
The average Sevenoaks home sold for £538,714 in July 2026, up 1.0% in a year. Prices by town and village, from Shoreham at £930,000 to Swanley at £400,000.
If you live in Sevenoaks, or you are trying to move here, the same question keeps coming up: what are houses actually worth right now? The asking prices in agents’ windows tell you what sellers hope for. The figure that matters is what homes genuinely change hands for, and that is recorded by HM Land Registry once every sale completes. This is a plain read of those numbers: the average price, which way it is moving, what you pay by property type, what homes actually sell for in each town and village, the streets where the money goes, and how Sevenoaks sits against Kent and the rest of England.
The headline figure
The average home in the Sevenoaks district sold for £538,714 in July 2026, the most recent month published. That is the provisional figure from the official UK House Price Index, which is built from completed Land Registry sales rather than asking prices.
A year earlier the average was £533,148, so prices are up 1.0% over the twelve months, a gain of £5,566. That is a sharp slowdown: a month ago the district was growing at 3.2% a year, ahead of the county. It is now behind Kent as a whole, which rose 1.5%, though still ahead of the South East at 0.2%. On the index the Land Registry publishes alongside the averages, where January 2023 is set at 100, Sevenoaks now stands at 102.8, so the district is about 2.8% above where it was three and a half years ago.
July was also a step back on the month. The average fell £7,387 from June, which is now the district’s highest month in a Land Registry series running back to January 1995. We covered that release, and where Sevenoaks sits against the other twelve Kent districts, in Sevenoaks house prices July 2026. The August figures are due on Wednesday 21 October.
One habit worth picking up before you quote any of these figures: the Land Registry restates recent months as more sales register. June was first published at £543,081 and has since been raised to £546,101, while May, first published at £553,752, now stands at £545,017. Always take the number from the latest release rather than an older report of the same month.
A note on the numbers you will see elsewhere. Search Rightmove and you may see an average closer to £900,000. That is not a contradiction. The Land Registry £538,714 covers the whole Sevenoaks local-authority district, including flats and terraces in Swanley and Edenbridge. The higher Rightmove average is weighted toward the larger detached houses in the TN13 town postcode and the affluent villages around it, where a single sale can run past £2 million and drag the average up. Both are real. They just measure different things, so always check which area and which property mix a figure refers to before you compare.
What it means for you
If you are selling a house, prices are still higher than a year ago, but the market has lost pace and one soft month does not make a trend either way. If you are selling a flat, the average is now lower than it was last summer. Pricing off a comparable sale from the past six months on your own street is worth more than any district average.
If you are buying, the pressure has eased: annual growth has fallen from 3.2% to 1.0% in a single release, and flats are cheaper than a year ago. Semi-detached and terraced homes, the rungs first-time buyers and second-steppers use, are still rising fastest, but at under 2% a year rather than the 4% of a month ago. It is worth checking the council tax band on any home you view, since that yearly bill is a running cost of the property that many buyers overlook while they fix on the asking price.
If you are staying put, your home has gained about £5,600 on paper in a year, a little behind Kent as a whole but ahead of the wider South East, though that only turns into money if you sell and move somewhere cheaper.
If you are renting, the two markets have pulled apart. Prices rose 1.0% over the year; rents rose 5.0%, and the district average reached £1,809 a month in August 2026. Our average rent in Sevenoaks page has the figure by bedroom count and property type, and the Kent league table it tops.
Prices by property type
The headline average hides a big spread. What you pay in Sevenoaks depends almost entirely on the kind of home you are after. These are the district averages for July 2026 from the UK House Price Index, with the change over the year:
- Detached houses: £1,012,433, up 1.1%. The Sevenoaks detached average has been above £1 million in every month since July 2025, when it first cleared that line at £1,001,179.
- Semi-detached houses: £537,825, up 1.9%. Within £889 of the district average, which is a fair sign of how much of this market is semis.
- Terraced houses: £426,822, up 1.7%. The most common route in for buyers wanting a house rather than a flat.
- Flats and maisonettes: £279,276, down 1.9%. The most affordable entry point, and the only type now cheaper than a year ago.
The pattern is the opposite of what people expect from a district known for its big houses. What growth there is sits in the middle of the market: semis and terraces rose faster than detached homes over the year, and flats fell. The step from a semi to a detached house is now roughly £475,000, which is what makes the last rung of the local ladder so hard to reach.
First-time buyers and home movers
The same data splits buyers in a useful way. A first-time buyer in the Sevenoaks district paid an average of £407,520 in July 2026, up 1.1% on the year. A home mover, someone selling one property to buy another, paid an average of £665,002, up 1.0%. The gap between those two figures, £257,482, is in effect the size of the step from a first flat or terrace to a family house in this part of Kent.
That first-time buyer average also sits £107,520 above the £300,000 point where first-time buyers’ stamp duty relief stops, so the tax bill is now part of the sum for most people buying their first home here. See GOV.UK on residential stamp duty rates for the current thresholds.
Prices by town and village
The district is far bigger than the town. It runs from Swanley and Hextable on the London fringe, down the Darent valley through Eynsford and Shoreham, out to Westerham on the Surrey border and Edenbridge in the south. The index does not publish below district level, so this table is built from the individual sales instead: every standard sale of a home in the district registered between 1 August 2025 and 31 July 2026, sorted into civil parishes by postcode. The median is the middle sale, and it is the fairer guide to a normal home; the average is pulled up by the handful of very large ones.
| Parish or town | Median sold price | Average | Sales |
|---|---|---|---|
| Shoreham | £930,000 | £1,005,123 | 13 |
| Penshurst | £867,500 | £932,791 | 12 |
| Chevening (Chipstead, Bessels Green) | £850,000 | £885,287 | 33 |
| Otford | £755,000 | £864,932 | 47 |
| Leigh | £725,000 | £758,519 | 13 |
| Riverhead | £665,000 | £848,717 | 31 |
| Sundridge with Ide Hill | £652,500 | £804,763 | 18 |
| Sevenoaks town | £640,000 | £926,346 | 226 |
| Halstead | £627,500 | £771,981 | 28 |
| Hartley | £620,000 | £593,984 | 56 |
| Brasted | £556,500 | £558,800 | 10 |
| Seal | £556,250 | £896,030 | 22 |
| Kemsing | £547,500 | £610,306 | 44 |
| Farningham | £535,000 | £561,029 | 17 |
| West Kingsdown | £517,500 | £567,677 | 48 |
| Eynsford | £490,000 | £550,939 | 33 |
| Westerham | £487,500 | £592,205 | 38 |
| Crockenhill | £485,000 | £514,062 | 16 |
| Hextable | £464,000 | £497,298 | 52 |
| Dunton Green | £415,000 | £457,814 | 49 |
| Edenbridge | £415,000 | £456,652 | 106 |
| Swanley | £400,000 | £382,441 | 182 |
| New Ash Green and Ash | £340,000 | £386,732 | 73 |
| Horton Kirby and South Darenth | £239,000 | £302,557 | 44 |
Parishes with fewer than ten sales in the year are left out, because a median built on three or four completions is not a market: that takes out Sevenoaks Weald, Chiddingstone, Hever, Fawkham and Knockholt among others. The 24 parishes listed cover 1,211 of the 1,259 sales.
Four things stand out.
Sevenoaks town is not the dearest part of its own district. Its median is £640,000, and Shoreham, Penshurst, Chevening and Otford all sit above it. That is not because the villages have grander houses than Kippington. It is because they have almost no flats: in Sevenoaks town 49 of the 226 sales were flats, at a median of £370,000, and that weight of cheaper stock drags the middle of the town’s market down. Shoreham recorded one flat sale all year.
The town average is where the £900,000 figure comes from. Take the mean rather than the median for Sevenoaks town alone and you get £926,346, which is the same order as the portal averages people quote for Sevenoaks. It is the same statistic the index publishes, measured over a different area: the £538,714 headline is a mean across the whole district including Swanley and Edenbridge, and £926,346 is a mean across the town parish only.
The cheapest entry points are in the north of the district. Horton Kirby and South Darenth has the lowest median at £239,000, and 25 of its 44 sales were flats. New Ash Green follows at £340,000, where 49 of 73 sales were terraced houses, and Swanley at £400,000. The Swanley, Hextable and Crockenhill belt is where the district’s cheaper stock sits, and it is the corner with its own station on the Victoria and Blackfriars lines.
Where the median and the average pull apart, one street usually did it. Seal’s median is £556,250 but its average is £896,030, because the four Wildernesse Avenue sales in the year included two above £3.2 million. The same effect gives Riverhead an average £183,717 above its median. Read the median column first.
The priciest streets
The index gives you the average. The Land Registry’s Price Paid record gives you the individual sales, so you can see where the money actually goes. In the twelve months to 31 July 2026 there were 1,259 standard sales across the Sevenoaks district, a count that has grown since we last updated this page because the Land Registry keeps registering sales months after they complete. These are the streets with at least three of them, ranked by the middle price of those sales:
| Street | Area | Median sold price | Sales |
|---|---|---|---|
| Oak Avenue | Sevenoaks town | £4,000,000 | 3 |
| Wildernesse Avenue | Seal | £2,667,500 | 4 |
| Seal Hollow Road | Sevenoaks town | £2,025,000 | 5 |
| Oak Lane | Sevenoaks town | £1,850,000 | 3 |
| Oakhill Road | Sevenoaks town | £1,800,000 | 5 |
| St Botolphs Road | Sevenoaks town | £1,800,000 | 3 |
| Shoreham Road | Otford and Shoreham | £1,666,500 | 5 |
| Brattle Wood | Sevenoaks town | £1,540,000 | 3 |
| Marlborough Crescent | Riverhead | £1,279,100 | 4 |
| Watercroft Road | Halstead | £1,040,000 | 3 |
The single highest price recorded in the district over those twelve months was £6,000,000, for a detached house on Park Lane in Sevenoaks that completed on 31 October 2025. Four more sales passed £3.5 million: two on Oak Avenue, at £5,198,800 on 10 July 2026 and £4,000,000 in December, one at Rosefield for £3,675,000, and one on Wildernesse Avenue at £3,600,000.
Two things are worth reading out of that table. The very top of the market is not all in the town: the Wildernesse estate at Seal and the lanes between Otford and Shoreham sit alongside the Kippington roads that Sevenoaks is known for. And a street median built on three or four sales is a snapshot, not a valuation, so treat it as a guide to where the expensive stock is rather than as the price of any particular house. Oak Avenue tops the table on three sales, one of which was that £5.2 million house.
The median across all 1,259 sales was £490,000, which is lower than the £538,714 index average. That is not a conflict. The index publishes a mean, and a handful of sales at £3 million and above pull a mean upwards while leaving the middle of the market where it is. If you want to know what a typical Sevenoaks home costs, the median is the more honest number; if you want to track the market month by month, the index is the one to follow.
How Sevenoaks compares to Kent and England
Sevenoaks is one of the more expensive places to buy in the South East, and it sits well above the county, the region and the national average. These are all the same Land Registry index for the same month, so they are directly comparable:
| Area | Average price | Change over the year |
|---|---|---|
| Sevenoaks district | £538,714 | +1.0% |
| South East region | £380,878 | +0.2% |
| Kent county | £346,904 | +1.5% |
| England | £293,479 | +1.1% |
In plain terms, the average Sevenoaks home costs £191,810 more than the typical home in Kent and about 1.8 times the England average. The pull of fast trains to London Bridge and Cannon Street, the grammar schools and the green setting on the edge of the North Downs all keep demand high, and that is what holds prices where they are. What has changed in the latest release is the pace: the district rose 1.0% in the year to July, behind Kent’s 1.5% and England’s 1.1%, having run ahead of both in the June release. It still grew faster than the South East at 0.2%, and faster than neighbouring Tunbridge Wells at 0.6%.
Frequently asked questions
What is the average house price in Sevenoaks?
The average home in the Sevenoaks district sold for £538,714 in July 2026, according to the provisional UK House Price Index built from HM Land Registry sales. That covers all property types across the local authority. Town-postcode averages weighted toward large detached homes can be much higher.
Are Sevenoaks house prices going up or down in 2026?
Up over the year, down in the latest month. Prices rose 1.0% in the year to July 2026, a gain of £5,566, against 1.5% across Kent and 0.2% across the South East. On the month the average fell £7,387 from June’s record. Flats are the weakest part of the market, down 1.9% on the year.
How much is a detached house in Sevenoaks?
A detached house averaged £1,012,433 in July 2026, up 1.1% on the year and above the £1 million mark, where it has been in every month since July 2025. That is close to double the average semi-detached price in the district.
Is Sevenoaks more expensive than the rest of Kent?
Yes, and by more than anywhere else in the county. The Sevenoaks average of £538,714 is £191,810 above the Kent average of £346,904, and about 1.8 times the England average of £293,479. It is the dearest of Kent’s 13 local authority areas, £82,487 ahead of second-placed Tunbridge Wells at £456,227.
Which is the most expensive village in the Sevenoaks district?
On sold prices over the twelve months to 31 July 2026, Shoreham had the highest median at £930,000, ahead of Penshurst at £867,500, Chevening at £850,000 and Otford at £755,000. All four sit above Sevenoaks town’s median of £640,000, mostly because they have almost no flats to pull the middle of their market down.
Where are the cheapest houses in the Sevenoaks district?
Horton Kirby and South Darenth, on a median of £239,000, then New Ash Green at £340,000 and Swanley at £400,000. All three are in the north of the district, and flats and terraced houses make up most of what changes hands there.
How much does a house cost in Sevenoaks town itself?
The median sale in the Sevenoaks town parish was £640,000 over the twelve months to 31 July 2026, across 226 sales. The mean for the same 226 sales was £926,346, and that gap is why portal averages for the town read so much higher than the district index figure of £538,714.
Which streets in Sevenoaks have the highest sold prices?
Over the twelve months to 31 July 2026 the highest street medians in the district were on Oak Avenue, Wildernesse Avenue at Seal and Seal Hollow Road, each with a median above £2 million. The single highest sale was £6 million, on Park Lane in Sevenoaks.
Where can I check what a specific house sold for?
Every completed sale in England and Wales is public. You can look up a street or a single address for free on the HM Land Registry Price Paid service, or browse the same data on Rightmove and Zoopla.
Sources
- UK House Price Index, Sevenoaks (ONS / HM Land Registry) for the district average, property-type and buyer-type figures and the Kent, South East and England comparisons.
- UK House Price Index for July 2026 (GOV.UK / HM Land Registry) for the national release the district figures come from.
- HM Land Registry Price Paid data for the street medians and the highest individual sales, taken from the open Price Paid record for the Sevenoaks local-authority district, 1 August 2025 to 31 July 2026, counting standard sales at full market value only. Postcodes were matched to civil parishes using the ONS and Ordnance Survey data behind postcodes.io.
- Rightmove Sevenoaks house prices for town-postcode market context.
Figures are provisional and revised as more sales complete. Always confirm the latest numbers against the linked HM Land Registry and ONS sources before making a decision.
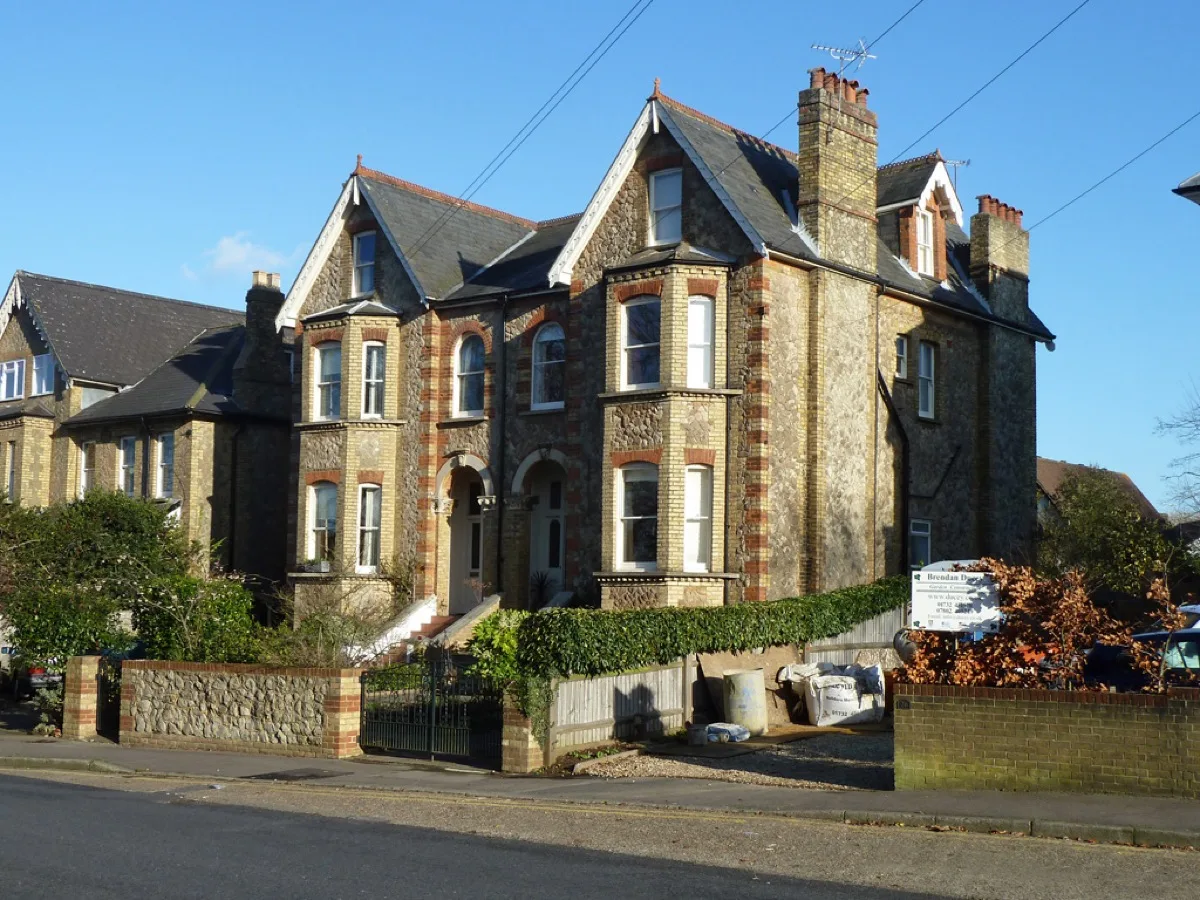
Image: “Houses on Dartford Road, Sevenoaks” by Robin Webster, CC BY-SA 2.0, via Wikimedia Commons (https://commons.wikimedia.org/wiki/File:Houses_on_Dartford_Road,Sevenoaks-geograph.org.uk-_6615585.jpg).
Have your say